
Above is a colorful representation of the 50 states. Representation in this map is indicative of-each state-with the least and most breweries per 100,000 residents. There is not much to be said for trending regarding distribution of maps with the 100K paramater. In other words, There are a few states in the New England region that potentially skew the findings due to population density in states on the adjacent West Coast, like Washington and Oregon.
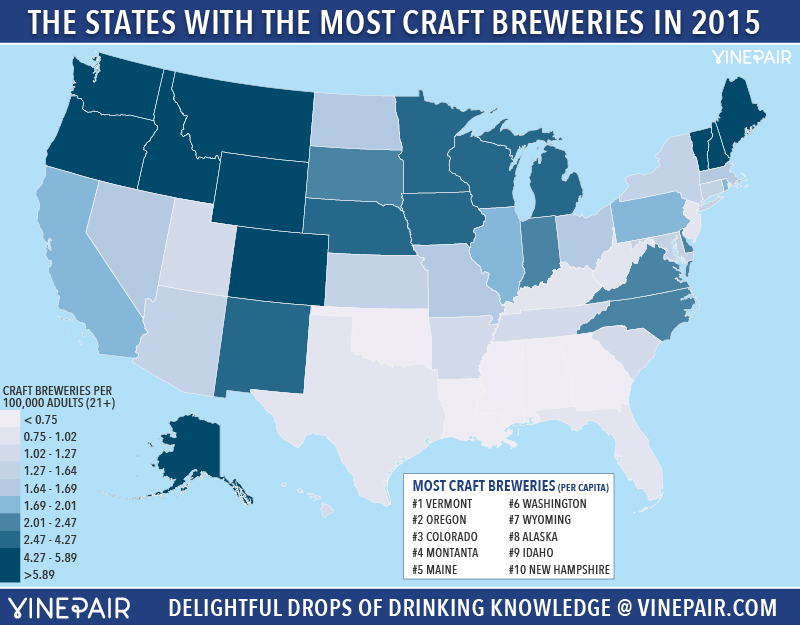
Traveling back a few years ago, this U.S. map, coincidently also in blue shades, relays to its viewer the states with the greates craft breweries per capita. Familiarly, this map too shows that the same three states in the New England Region dominate the East Coast while at the same time, the majority-rule for the West Coast is Washington and Oregon. Perhaps not as noticeable in other maps, this map shows that a large portion of the Northern, and West regions respectively dominate in craft brewery prodution.
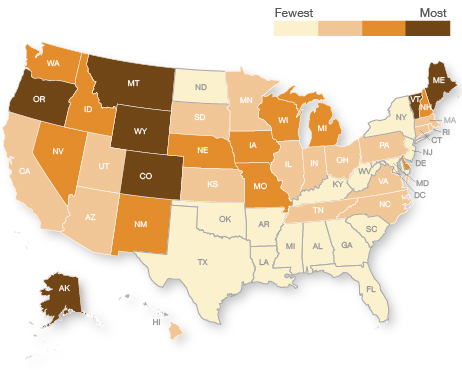
As simple as they come, this map shows with vary distinct color representation, which states have the most breweries and those with the least-not to exclude the two in-between options. Not too surprising, this map shows the same two predominant regions dominating the brewery game: New England and the Pacific Northwest take the cake for brewery production. A trending, but unsure possible third party in competition to these two regions are Montanta andWyoming; unsurprisingly, Colorado is Queen for breweries.

As recently as 2018, the above map highlights major metropolitan cities across the U.S. in which microbreweries and brew pubs alike dominate the social scene. Cities such as Portland and Denver should be of no surprise; but perhaps not formerly considered to be brew hotspots are cities like Cincinnati and Chicago. This map is also from a pole taken with cities containing more than 40k residents, and the source is The Pudding-decide for yourself how accurate this map is!
/http%3A%2F%2Fadmin.mashable.com%2Fwp-content%2Fuploads%2F2014%2F06%2Fbeer-map.jpg)
Similarly to the previous map, this map uses a social platform to indicate microbreweries in which Pinterest users have expressed interest. Not to be discredited in its entirety, this map does show simiilar trends to the more credibly sourced maps indicatiing brewery distribution and trends through regions. However, the dots represented repeat in color, but no key is available to discern their overall intent to the viewer.

Again, this map represents the number of breweries per state. However, there is no indication of what the numbers mean; as in, the values are not being adequately accounted for. What is less or equal to 49 telling the viewer? Are the less than or equal to 49 breweries in the state of North Dakota? More than likely the answer is yes, but it could unfathomably be 49 thousand!
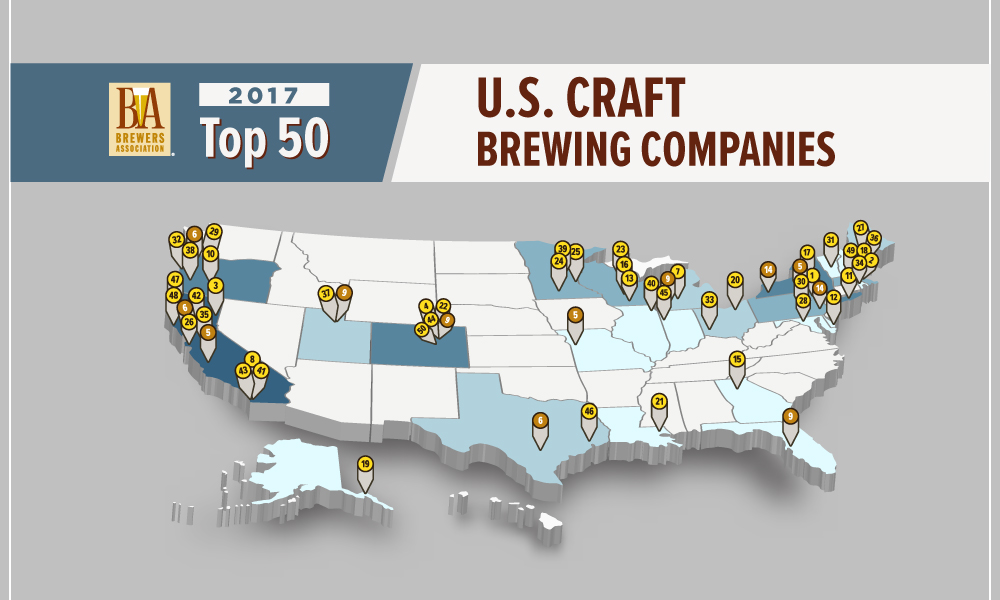
Stepping back once again, this map shows the Top 50 breweries in the U.S. for the year 2017. The dominant trend represented is that the Northeast and West Coast are massive producers of beer. The exception is always Colorado-notorious for its beer and brewery culture. The North once again shows that they enjoy a pint or two as well.
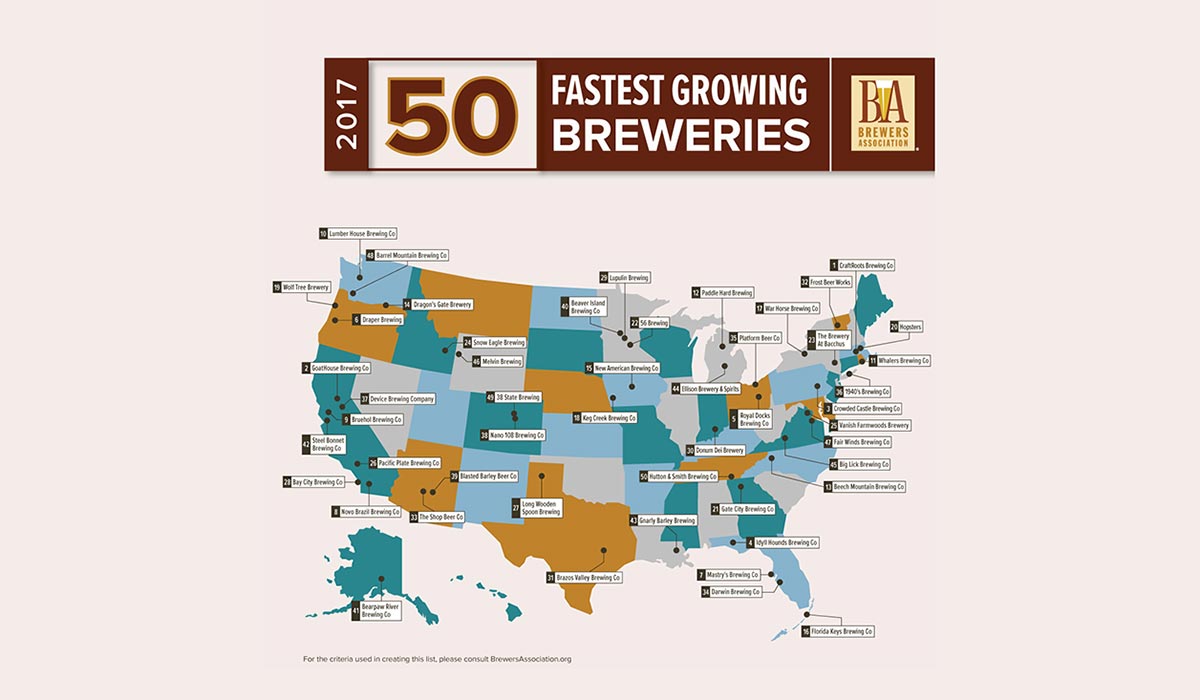
Not to be confused with the previous map, the map above shouts-out to the 50 fastest growing breweries in 2017. There is not much for trending with regards to this map. Props to the breweries that made the cut according the the Brewers Association; many "clinks" and reviews to these growing entreprenuers!

A unique take on breweries in the United States, this map takes a zoomed-in approach to highlighting areas across the U.S. with signfigant distributions of breweries. It is noticeable, from this map alone, that nearly every geographically disected region of the U.S. has an area attributing a brewery "sensation". However, this map also shows that the area of Montana, Noth Datkota, Wyoming, and South Dakota, in particular, do not make the cut for brewery distribution.
Produced by Brittany Bedor